Thursday, September 19, 2013

How I learnt about brewing?


I know what are you thinking. I know what would your reaction be after reading this paragraph. I know you must be thinking where has she learnt about brewing. I’m going to talk about a fairly simple kind of brewing in this post – the coffee brewing. Not exactly how coffee beans (Arabica, Robusta and many others) are dried and powdered or converted into other form, instead I’m going to talk about these special coffee brewing machines. The vending machines – yes. The stimulants that help us come out of our Monday morning blues/hangovers/dizziness and boredom at times.

We have a coffee brewing machine here in the US office. There are a dozen of flavoured coffees placed alongside, my first time I saw these many varieties. I took a little more than 2 minutes to decipher the names and picking up one took another few seconds. There were varieties like the French roasts, French Vanilla roasts, Breakfast blend, Sumatran blends, some decaffeinated and others not. The machine required me to press on the ‘Open’ button foremost. After I pressed it, a thing opened up on which we could place the coffee pod I had picked up. After experimenting for nearly 2 weeks, I figured out that the basic one suits me the best, of course I’m talking about ‘Breakfast blend’. So, you open a coffee pouch to pick up the pod and place it on the opened up ‘container’ thingy of the machine. I then was required to press one out of the three available options – Mild, Medium or Bold. As an average human being, who tries testing the mediocre things, I pressed on the ‘Medium’ button, thinking I would move to ‘Mild’ or ‘Bold’ depending on the strength of the one I’m trying. The sign on the machine now changed to ‘Brewing’ and drops of brown colored liquid started pouring into the cup I had placed inside the machine. I stared at the machine till my cup was full and the machine said ‘Ready’.

I have tried different kinds of coffee in India too (This post is when I’m working from the NYC office). There are options of choosing your own spices. I like the South Indian filter coffee the most, with milk and little sugar, the smell of that coffee attracts me from a distance and what an amazing combination is a Butter Dosa with strong filter coffee. Here it goes,

Friday, July 19, 2013

Experiment


Tuesday, June 11, 2013

Format painter

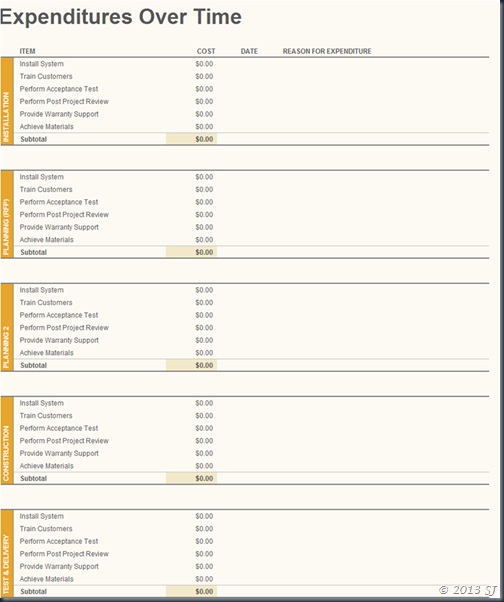
Its a great tool for those who wish to have a consistent formatting in their reports – items ranging from colours to fonts to number formats. Look at the following picture as an example.

Base formatting

I have specific colours decided for this particular part of the excel. Now if I have to apply similar formatting to the other tables in the tab, I’m going to use ‘Format painter’. I’m also not going to click on Format Painter every other time, I will double click on it and apply on all the tables I wish to. The formatted sheet looks somewhat like this:

Formatted Sheet

Hit ‘Format Painter’ once you are done with formatting or just click on ‘Esc’ key and you are done. Now, isn’t this cool.

Sunday, June 9, 2013

Excel: Showing percentages in Column charts

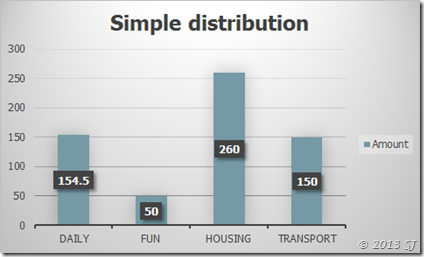
MS Office has provided us with a lot of options to create graphs - Bar/Column charts, Pie charts, Line charts and Area charts are just to name a few. Each one is important at different times, to show different things. For example, to show the different categories of spends in a month and know the amount spent on each one, the best one (as we would think) would be a column-chart:-

image

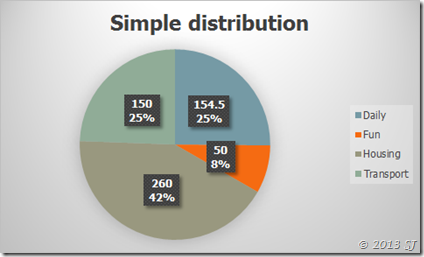
But what the chart doesn’t do is show how much more or how much less was spent on one category than the other. The following chart does both the jobs:

image

It gives the value and the percentage split as well. As you see, everything about the expenses last month is answered. You can make a judgmental call from here. Chart formatting is what comes in handy for cases like these. We have enormous number of options for showing the things we want  in a particular way – colours/labels/size/borders/etc.

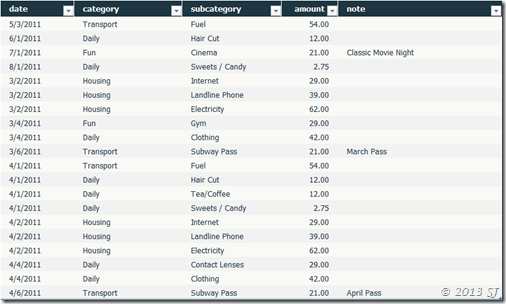
For some exercise, I had wanted to show the percentage distribution in a bar chart a few weeks back. Lets take this data for example:

image

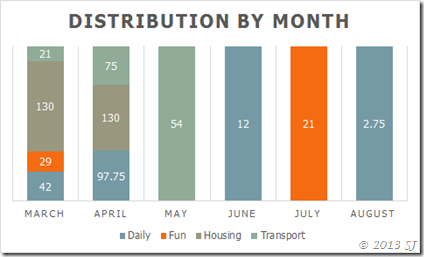
I had wanted to show the change in distribution of categories over months. And this is all that I could get to using the direct chart making techniques available in Excel.

image

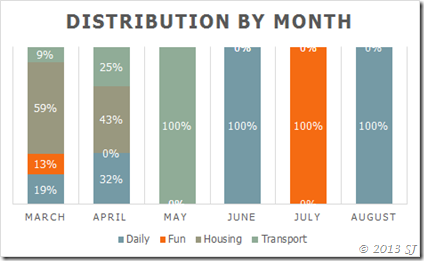
But this did not give me the percentage distribution of the different categories at a monthly level. I modified the datasheet the following way (making sure the user doesn’t get to see it by re-colouring the font white).

image

And here is the chart with the information we want to convey:

image

Take care!

Thursday, November 15, 2012

Weird

Diwali time it was. She was getting married a month after the main festival. The family had just returned back from the local temple nearby after performing the festive rituals. Next was dinner time. She had prepared something special for the family that day. The father who never really appreciated food cooked at home started talking about it all of a sudden. He talked about the right mix - ingredients, the way it was cooked and served and the taste. After dinner, they called up relatives in the different corners of the country. Then it was the family outing time. They wished all the neighbours a happy festive time. The mother stared at the rangoli made by her and asked her not so techy husband to take a picture of the Rangoli. The mother looked at the photograph herself to make sure the one painted by her daughter was well captured. While she was bursting crackers, the father asked her to get to a fine looking corner of the otherwise crowded place. He handed her two brightly lit sticks and asked her to hold them when he clicked her photograph.

She did not understand as to what was wrong with her parents and why they were behaving 'so Weird'!
----

Grandmom had died 15 days back. The family was trying to come out of the shock or so she believed. She had come back from Bangalore. She had caught the next flight she could when she heard the news while sitting in one of the tiny meeting rooms. Grandmom was not keeping well for quite sometime but Reality was hard to face. So she was back to her native place to look at the face of her Grandmom with blood and bones for one last time. The next time she would look at that face, it would be a hanging photograph placed in the dining hall. That is where the pictures of all the dead people of the house were hung. The final ceremonies were performed. Every little thing liked and loved by her Grandmom was made during the 12 days of the ceremony. On the 15th day, all the four brothers had gathered up to divide the expenses that had happened during the last 2 weeks. 

She was the one helping the elders with additions and divisions. While they were busy writing all the particulars, an aunt from the corner shouted and informed her husband about the garland expenses. She looked at the hanging  photograph of her Grandmom, felt happy that she was no longer there to hear such a thing, a drop of tear fell from her eyes and the amount was perfectly divided. 'Weird' she said to herself such that no one could hear.
----

Scene1:
A: So what did you do last evening?
B: O not much... we watched 'Bigg Boss' over television and i cooked Yellow rice with dal.
A: I see... You know, C makes amazing Yellow rice
B: Yeh. C is a brilliant cook. I wish i could learn from her.

Scene2:
A: I heard you made a job, what's the name of your company?
B: Its a college aunty, ABC Inst. of Technology.
A: D works in Google, couldn't you make it there?
B: No! It doesn't come to our campus. Even if it would have, i would not have probably made it.
A: Google is the best company to work with. You should better your skills and try applying for a position there.
B: Ok.

Scene3:
B: How are you doing?
A: Good. So, how are your teaching classes coming up?
B: Not bad. The children seem to be liking me.
A: Teaching is a very boring job.
B: Hmm...
A: Its difficult teaching the same thing over and over again.
B: Hmm...
A: The college you work for is not that reputed.
B: Hmm...
A: You don't talk much, do you?
B: Ya!
A: How are things otherwise?
B: Weird!

Friday, October 26, 2012

A liner

There are times when a single line can send pricks to your heart, they can make you take life-turning decisions, they can touch those sensitive nerves, they can cause those imbalances and make you do wonders. I received a liner from my maternal Grandmom this morning. She said "Both the little girls, try coming home early" in her beautiful handwriting. One of the best lines (from the very many) that I have received from my Superpartner has been 'On a relatively important Day' when he gave me a Panasonic camera.

Sunday, September 23, 2012

Becoming Learn-ed


We learn just too many things in life but how many do we apply day in and out, rarely a few. No wonder people of the earlier generations gave so much emphasis on the womenfolk learning to cook well because that's something you can't survive without. I learnt how to make masks and chains with the orangies (I call them so, otherwise they are called 'BuckyBalls' and HE laughs when i used the word 'orangies').
In multi-national organizations, some weightage (Performance Appraisal) is also given to the kind of trainings you attend and deliver. A few months ago I attended one delivered by two people, one of the trainers was a Gold medalist from ISI. I tried hard to understand what he was planning to deliver and looked at the other trainees, most of who were sipping cups and cups of coffee to keep themselves awake during the session. The other trainer scored her 8.5 out of a 10 and the brilliant Gold medalist had a tough luck with keeping people happy and scored a bare 1.5.
There are the best and worst forms of things you experience in life. For example, people say 'he is the most wonderful person i have met till date' and the sentence holds true till they don't meet a more wonderful person. As we are talking about trainings here, I will state one as was narrated to me by one of the friends. There were two trainers again and a bunch of 20 trainees. The theoretical part was very well explained by the first trainer and when everyone was looking forward to some interesting exercises and case studies by the second trainer, the expectations went for a toss, passing seconds seemed like days and mobiles became the loveliest things and one of the trainees just became an observer. A third eye view of what happened across the room.
A graph was shown which apparently had 3 lines running from left to right. One of the lines was black in colour.
Trainee: What does the black line represent?
Trainer: It is the ROP line
Trainee: That's okay, but what does it represent?
Trainer: It is the ROP which is dependent on the AOP
Trainee: That's okay but I want to know as to what does it represent?
Trainer: It is the ROP line showing averages for the last 12 months
Trainee: I want to know as to what does the line signify, why is it drawn here and how does one interpret the line or read it
Trainer: It is the black dotted line that has been cut and pasted from the graph I showed in my last slide
Trainee: Thanks!
and the trainee went into peaceful sleep for the next part of the session.
Another one was trying hard to get the head and tail out of the session and was beating the floor so hard that the carpet seemed to be coming out. One turned his face into that of an ill-looking donkey who was not fed for days. One looked at the trainer as if that was the last time he was looking at her. A few ordinary ones opened up the games on their phones and started playing. A desperate few tried hard to make out what was told until someone shouted 'Stop it!' and things came to a standstill.